Aug 2025 - Dec 2025
Aug 2025 - Dec 2025
• Sponsored Project
• Sponsored Project

Overview
Overview
Overview
Brief
Brief
Brief
Transformed legacy enterprise B2B Business platform into modern AI-powered dashboard
Transformed legacy enterprise B2B Business platform into modern AI-powered dashboard
Transformed legacy enterprise B2B Business platform into modern AI-powered dashboard
Role
Role
Role
Product Designer
Product Designer
Product Designer
Timeline
Timeline
Timeline
16 Weeks
16 Weeks
16 Weeks
Team
Team
Team
Jun Hyok Lim
Jun Hyok Lim
Jun Hyok Lim
Ashton Sun
Ashton Sun
Ashton Sun
Vipula Shirse
Vipula Shirse
Vipula Shirse
Brynn Davis
Brynn Davis
Brynn Davis
Ryan Pearson
Ryan Pearson
Ryan Pearson
Anika Gupta
Anika Gupta
Anika Gupta
Amrita Saripalli
Amrita Saripalli
Amrita Saripalli
Background
Background
Background
Project Description
Project Description
Project Description
Lending Insights is Allied Solutions’ BI platform for credit unions. Every month, lending leaders need audit-ready reports and a high-level view of portfolio performance.
However, the legacy custom reporting tool was complex and unintuitive, forcing many users to rely on Allied Support to generate reports, slowing decisions and increasing support load.

102%
User
User
User
Credit Union Lender Team
Credit Union Lender Team
Credit Union Lender Team
They use lending insights to:
They use lending insights to:
They use lending insights to:
Review loan performance
Review loan performance
Review loan performance
Monitor risk
Monitor risk
Monitor risk
Prepare monthly reports
Prepare monthly reports
Prepare monthly reports
Efficiency
Accuracy
Speed
Security
Meaningful Reporting Creation
User Needs
User Needs
User Needs
The Problem to Solve
The Problem to Solve
The Problem to Solve
They need a faster, clearer way to create and customize reports without relying on support, so they can confidently access insights and make timely lending decisions.
They need a faster, clearer way to create and customize reports without relying on support, so they can confidently access insights and make timely lending decisions.
They need a faster, clearer way to create and customize reports without relying on support, so they can confidently access insights and make timely lending decisions.
Current State
Current State
Current State
Pain points
Pain points
Pain points
Confusing reporting setup
Confusing reporting setup
Confusing reporting setup
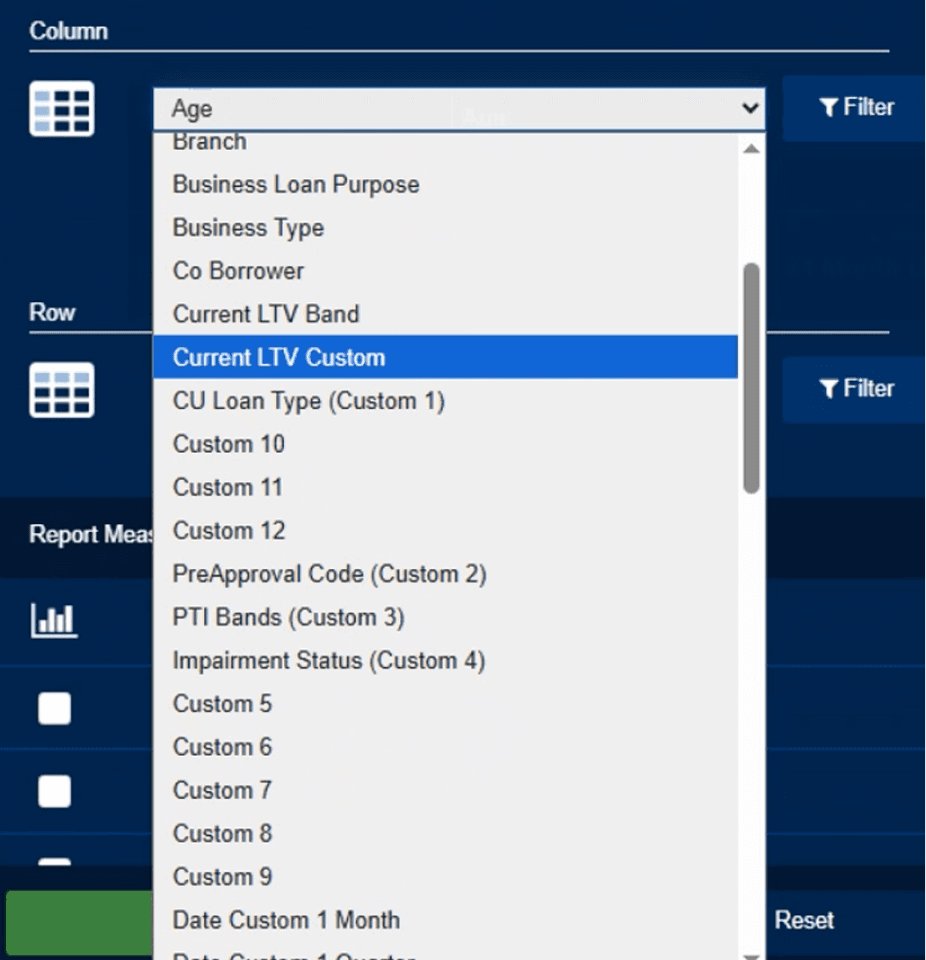
Ambiguous labels such as “Report Configuration” and “Custom 10”
Ambiguous labels such as “Report Configuration” and “Custom 10”
Ambiguous labels such as “Report Configuration” and “Custom 10”
Unintuitive workflow
Unintuitive workflow
Unintuitive workflow
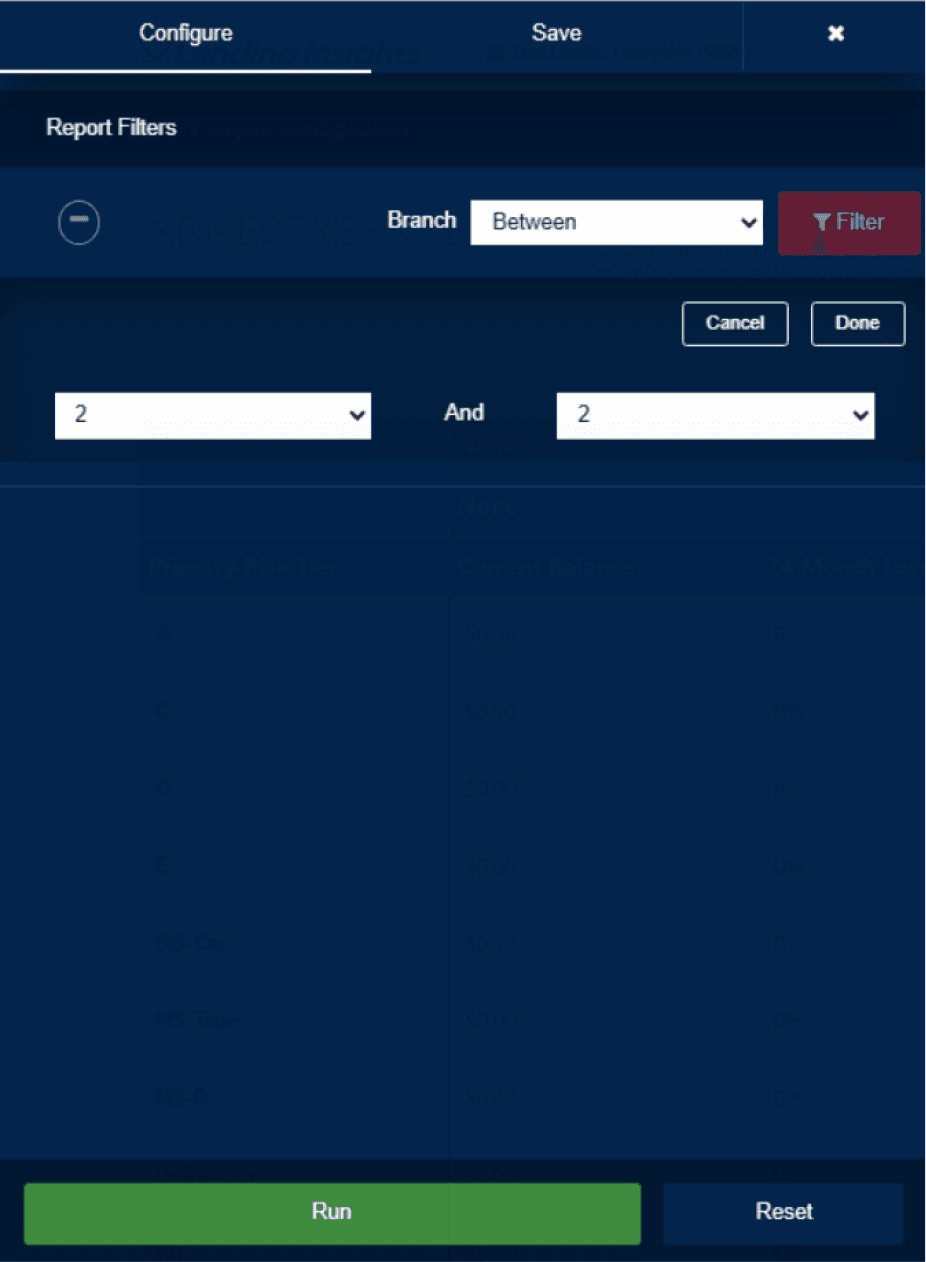
Multiple complex functions control filters and actions on graphs/tables without feedback
Multiple complex functions control filters and actions on graphs/tables without feedback
Multiple complex functions control filters and actions on graphs/tables without feedback

Missing Core Functionality
Missing Core Functionality
Missing Core Functionality
Users could not filter or search for graphs, nor create multiple graphs of the same measure
Users could not filter or search for graphs, nor create multiple graphs of the same measure
Users could not filter or search for graphs, nor create multiple graphs of the same measure
Goal
Goal
Goal
Guiding question
Guiding question
Guiding question
How might we empower credit union teams to create and manage reports independently, faster and more clearly, with AI guidance?
How might we empower credit union teams to create and manage reports independently, faster and more clearly, with AI guidance?
How might we empower credit union teams to create and manage reports independently, faster and more clearly, with AI guidance?
Make it easier to
Make it easier to
build reports
create custom reports
understand lending performance
apply filters and see changes
customize dashboards
get insights with AI guidance
build reports without support
create custom reports
build reports
create custom reports
understand lending performance
apply filters and see changes
customize dashboards
get insights with AI guidance
build reports without support
create custom reports
Research
Research
Research
Competitive Analysis
Competitive Analysis
Competitive Analysis
To understand how competitors solve common user challenges around navigation, terminology, workflow efficiency, and AI integration within reporting tools, I analyzed different custom reporting platforms and found information from each of the platforms, including Domo, Tabs, Tableau, Sisense, and Fabi AI to identify key custom reporting and AI features.
To understand how competitors solve common user challenges around navigation, terminology, workflow efficiency, and AI integration within reporting tools, I analyzed different custom reporting platforms and found information from each of the platforms, including Domo, Tabs, Tableau, Sisense, and Fabi AI to identify key custom reporting and AI features.
To understand how competitors solve common user challenges around navigation, terminology, workflow efficiency, and AI integration within reporting tools, I analyzed different custom reporting platforms and found information from each of the platforms, including Domo, Tabs, Tableau, Sisense, and Fabi AI to identify key custom reporting and AI features.

Custom Reporting
Custom Reporting
Custom Reporting
Each module has one main dashboard where you can customize widgets, use ready-made reports, and filter information easily.
Each module has one main dashboard where you can customize widgets, use ready-made reports, and filter information easily.
Each module has one main dashboard where you can customize widgets, use ready-made reports, and filter information easily.

Placement & Terminology
Placement & Terminology
Placement & Terminology
The dashboard has simple buttons with icons or clear labels at the top right to add widgets, filter data, and export information.
The dashboard has simple buttons with icons or clear labels at the top right to add widgets, filter data, and export information.
The dashboard has simple buttons with icons or clear labels at the top right to add widgets, filter data, and export information.

AI Opportunities
AI Opportunities
AI Opportunities
The AI feature lets users ask questions, get forecasts, generate reports, see simple summaries, and receive alerts based on their data.
The AI feature lets users ask questions, get forecasts, generate reports, see simple summaries, and receive alerts based on their data.
The AI feature lets users ask questions, get forecasts, generate reports, see simple summaries, and receive alerts based on their data.
Prototype
Prototype
Prototype
AI Prototyping
AI Prototyping
AI Prototyping
I designed two functional prototypes, Version A and Version B, to conduct A/B testing and determine which AI features best support our users' needs. Using Figma Make, our team rapidly developed these contrasting versions to identify the most effective layout and workflow for the final design.
I designed two functional prototypes, Version A and Version B, to conduct A/B testing and determine which AI features best support our users' needs. Using Figma Make, our team rapidly developed these contrasting versions to identify the most effective layout and workflow for the final design.
I designed two functional prototypes, Version A and Version B, to conduct A/B testing and determine which AI features best support our users' needs. Using Figma Make, our team rapidly developed these contrasting versions to identify the most effective layout and workflow for the final design.
*Hover to see touchpoints*
Version A
Version B

Pre-populated Reports
access relevant data through ready-made reports
Ask AI
find specific data by typing questions like "Show car loan risks."
Building report
Configuring widget
Filtering Experience
AI Interaction Points
Saving & Reporting
Version A
Version B
Ask AI
find specific data by typing questions like "Show car loan risks."
Building report
Configuring widget
Filtering Experience
AI Interaction Points
Saving & Reporting
Testing
Testing
Testing
A/B Testing with SMEs
A/B Testing with SMEs
A/B Testing with SMEs
I validated two early design concepts (Version A and Version B) with SMEs, gather actionable feedback, and refine the reporting redesign to better meet user and organizational needs.
I validated two early design concepts (Version A and Version B) with SMEs, gather actionable feedback, and refine the reporting redesign to better meet user and organizational needs.
I validated two early design concepts (Version A and Version B) with SMEs, gather actionable feedback, and refine the reporting redesign to better meet user and organizational needs.
Save
Report Accessibility
Report Accessibility
Report Accessibility
Users prefer having saved reports easily accessible, ideally at the top of the page or within the global navigation, rather than buried inside the custom reporting tool.
Users prefer having saved reports easily accessible, ideally at the top of the page or within the global navigation, rather than buried inside the custom reporting tool.
Users prefer having saved reports easily accessible, ideally at the top of the page or within the global navigation, rather than buried inside the custom reporting tool.
AI Capabilities
AI Capabilities
AI Capabilities
AI forecasting is a desired feature to help users anticipate trends and make data-driven decisions more efficiently.
AI forecasting is a desired feature to help users anticipate trends and make data-driven decisions more efficiently.
AI forecasting is a desired feature to help users anticipate trends and make data-driven decisions more efficiently.
Global Reporting & Flexibility
Global Reporting
Global Reporting
Users want to easily compare and combine data from different widgets in one report, instead of looking at each widget separately.
Users want to easily compare and combine data from different widgets in one report, instead of looking at each widget separately.
Users want to easily compare and combine data from different widgets in one report, instead of looking at each widget separately.
Final Stage
Final Stage
Final Stage
High-Fidelity Design
High-Fidelity Design
High-Fidelity Design
*Hover to see touchpoints*
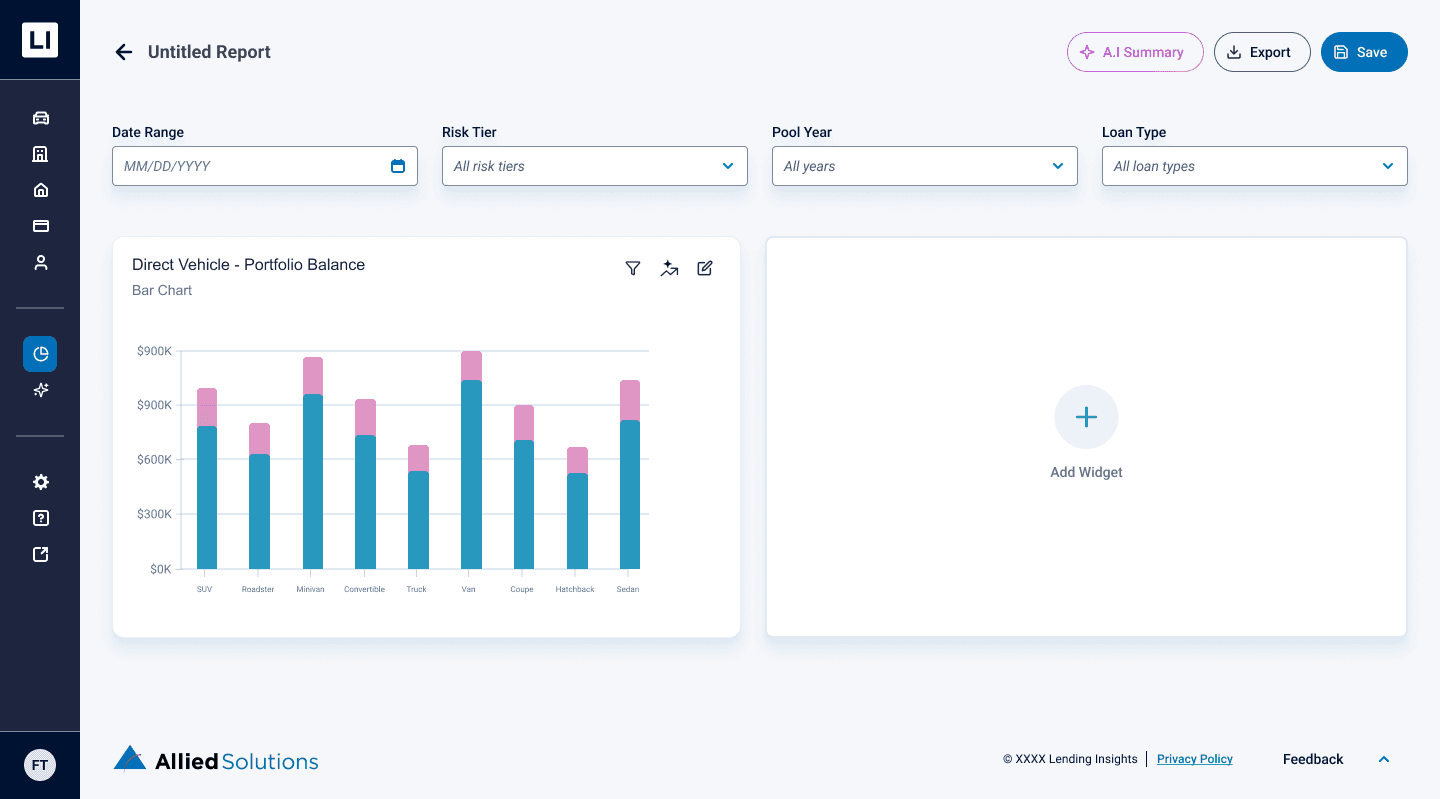
Custom Reporting Homepage
Custom Reporting Homepage
Custom Reporting Homepage

AI Generator
use AI to generate a report by entering a prompt.
Entry points
prebuilt templates help users to begin without starting from scratch
Recognition
saved reports use previews for quick visual identification
Building Report
Building Report
Building Report
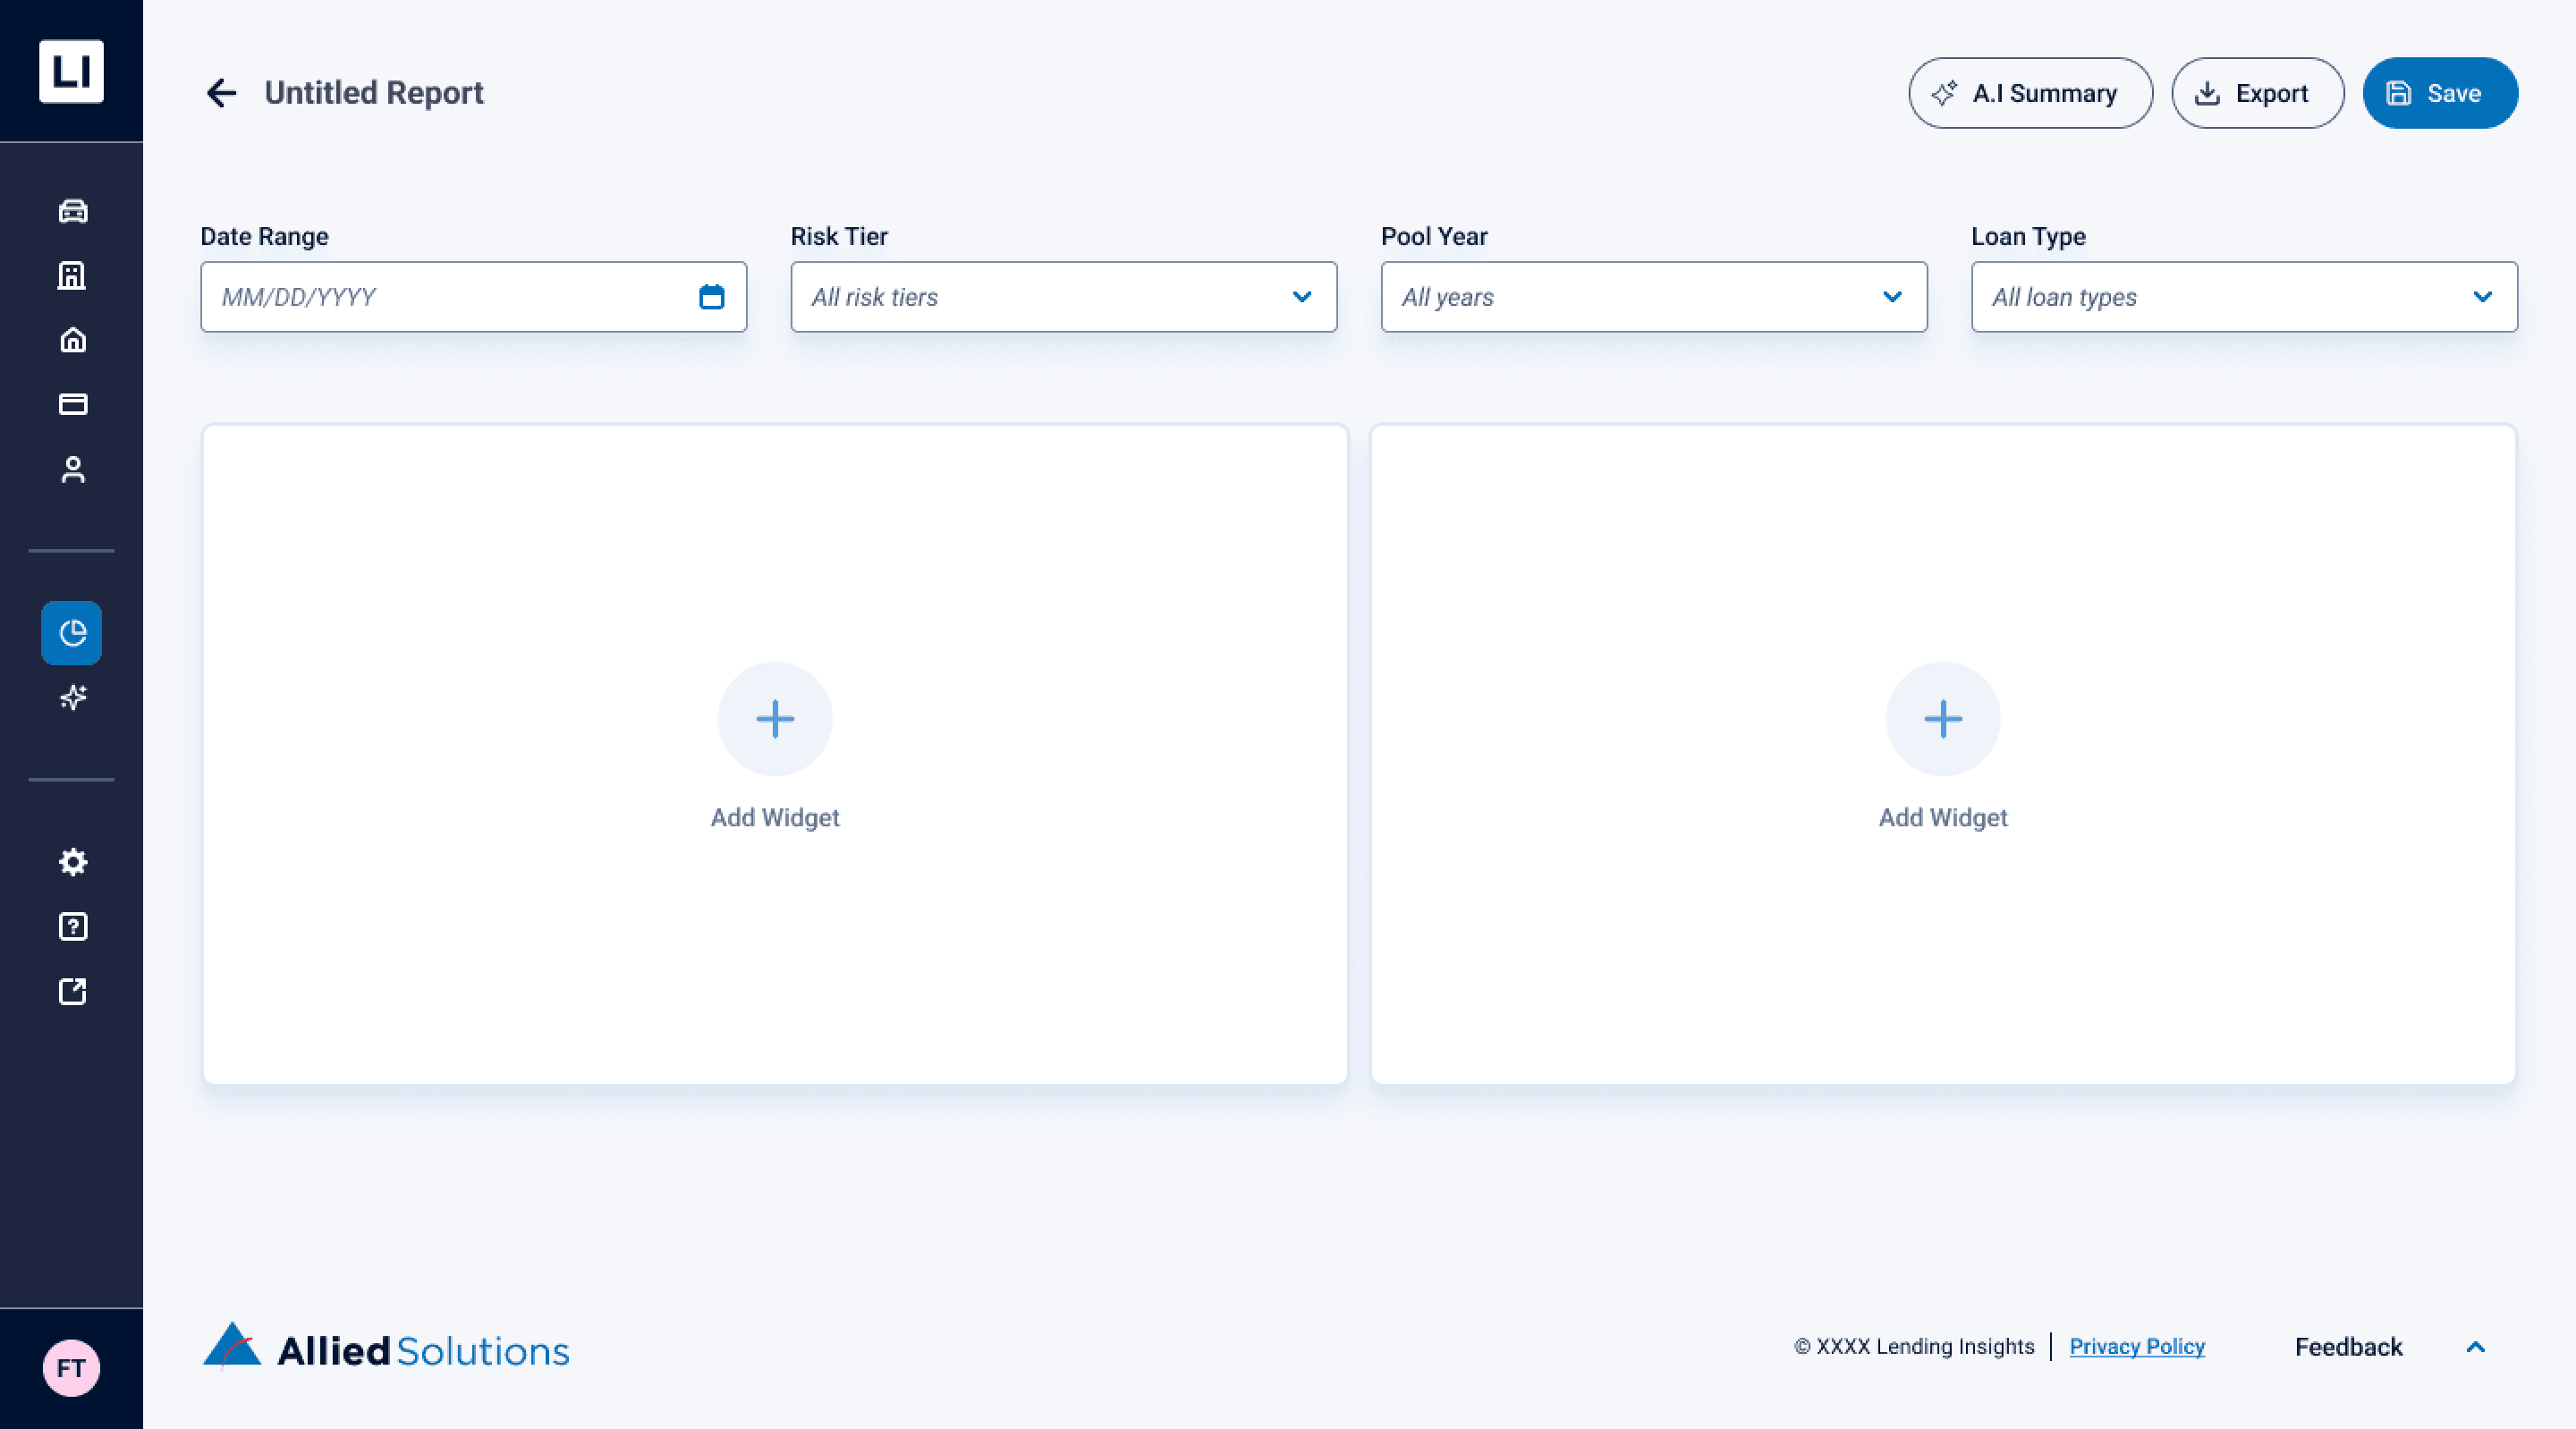
Global Report
apply filter once to update the whole report
Add Widget
Add graphs, KPIs, or tables to display data
Save & Export
save the report and easily preview, download, or share
Add Widget
Add Widget
Add Widget
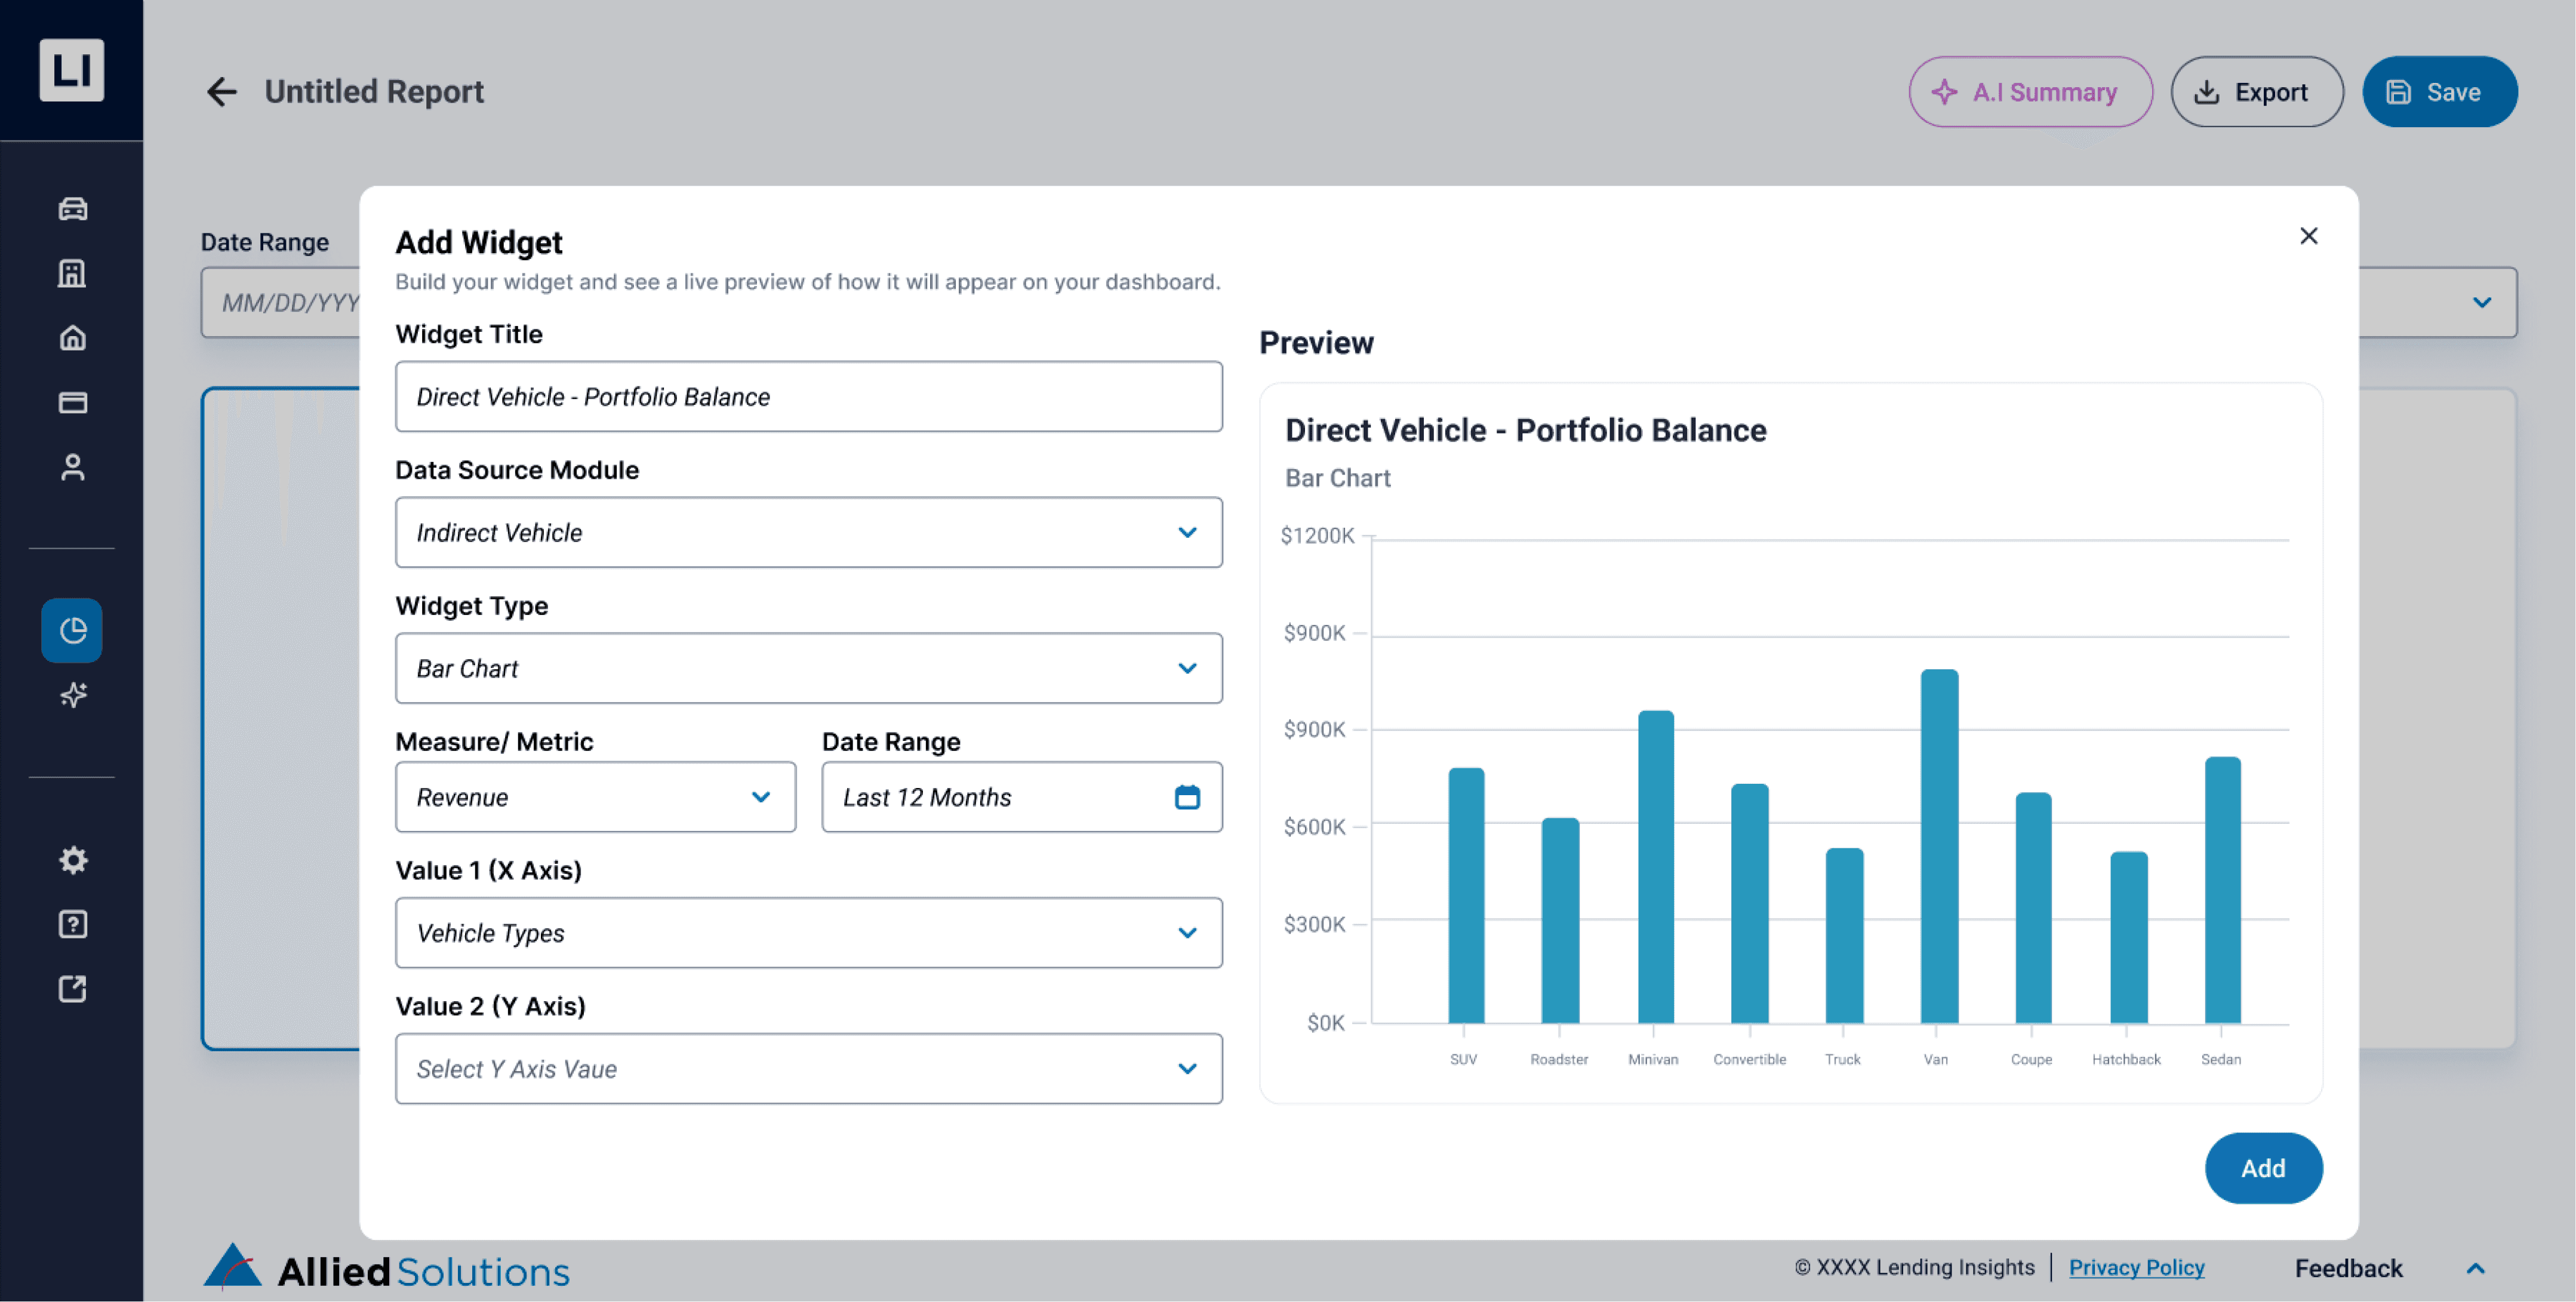
Customization
set data, chart type, and values for the widget
Live preview
see the widget update instantly as you edit.
Filled Report
Filled Report
Filled Report
AI forecasting
add future projections to a chart by selecting a date range.
AI Summary Prompt
AI Summary Prompt
AI Summary Prompt

AI summary setup
name the summary, choose widgets, and guide AI with optional prompts.
AI Generated Summary
AI Generated Summary
AI Generated Summary
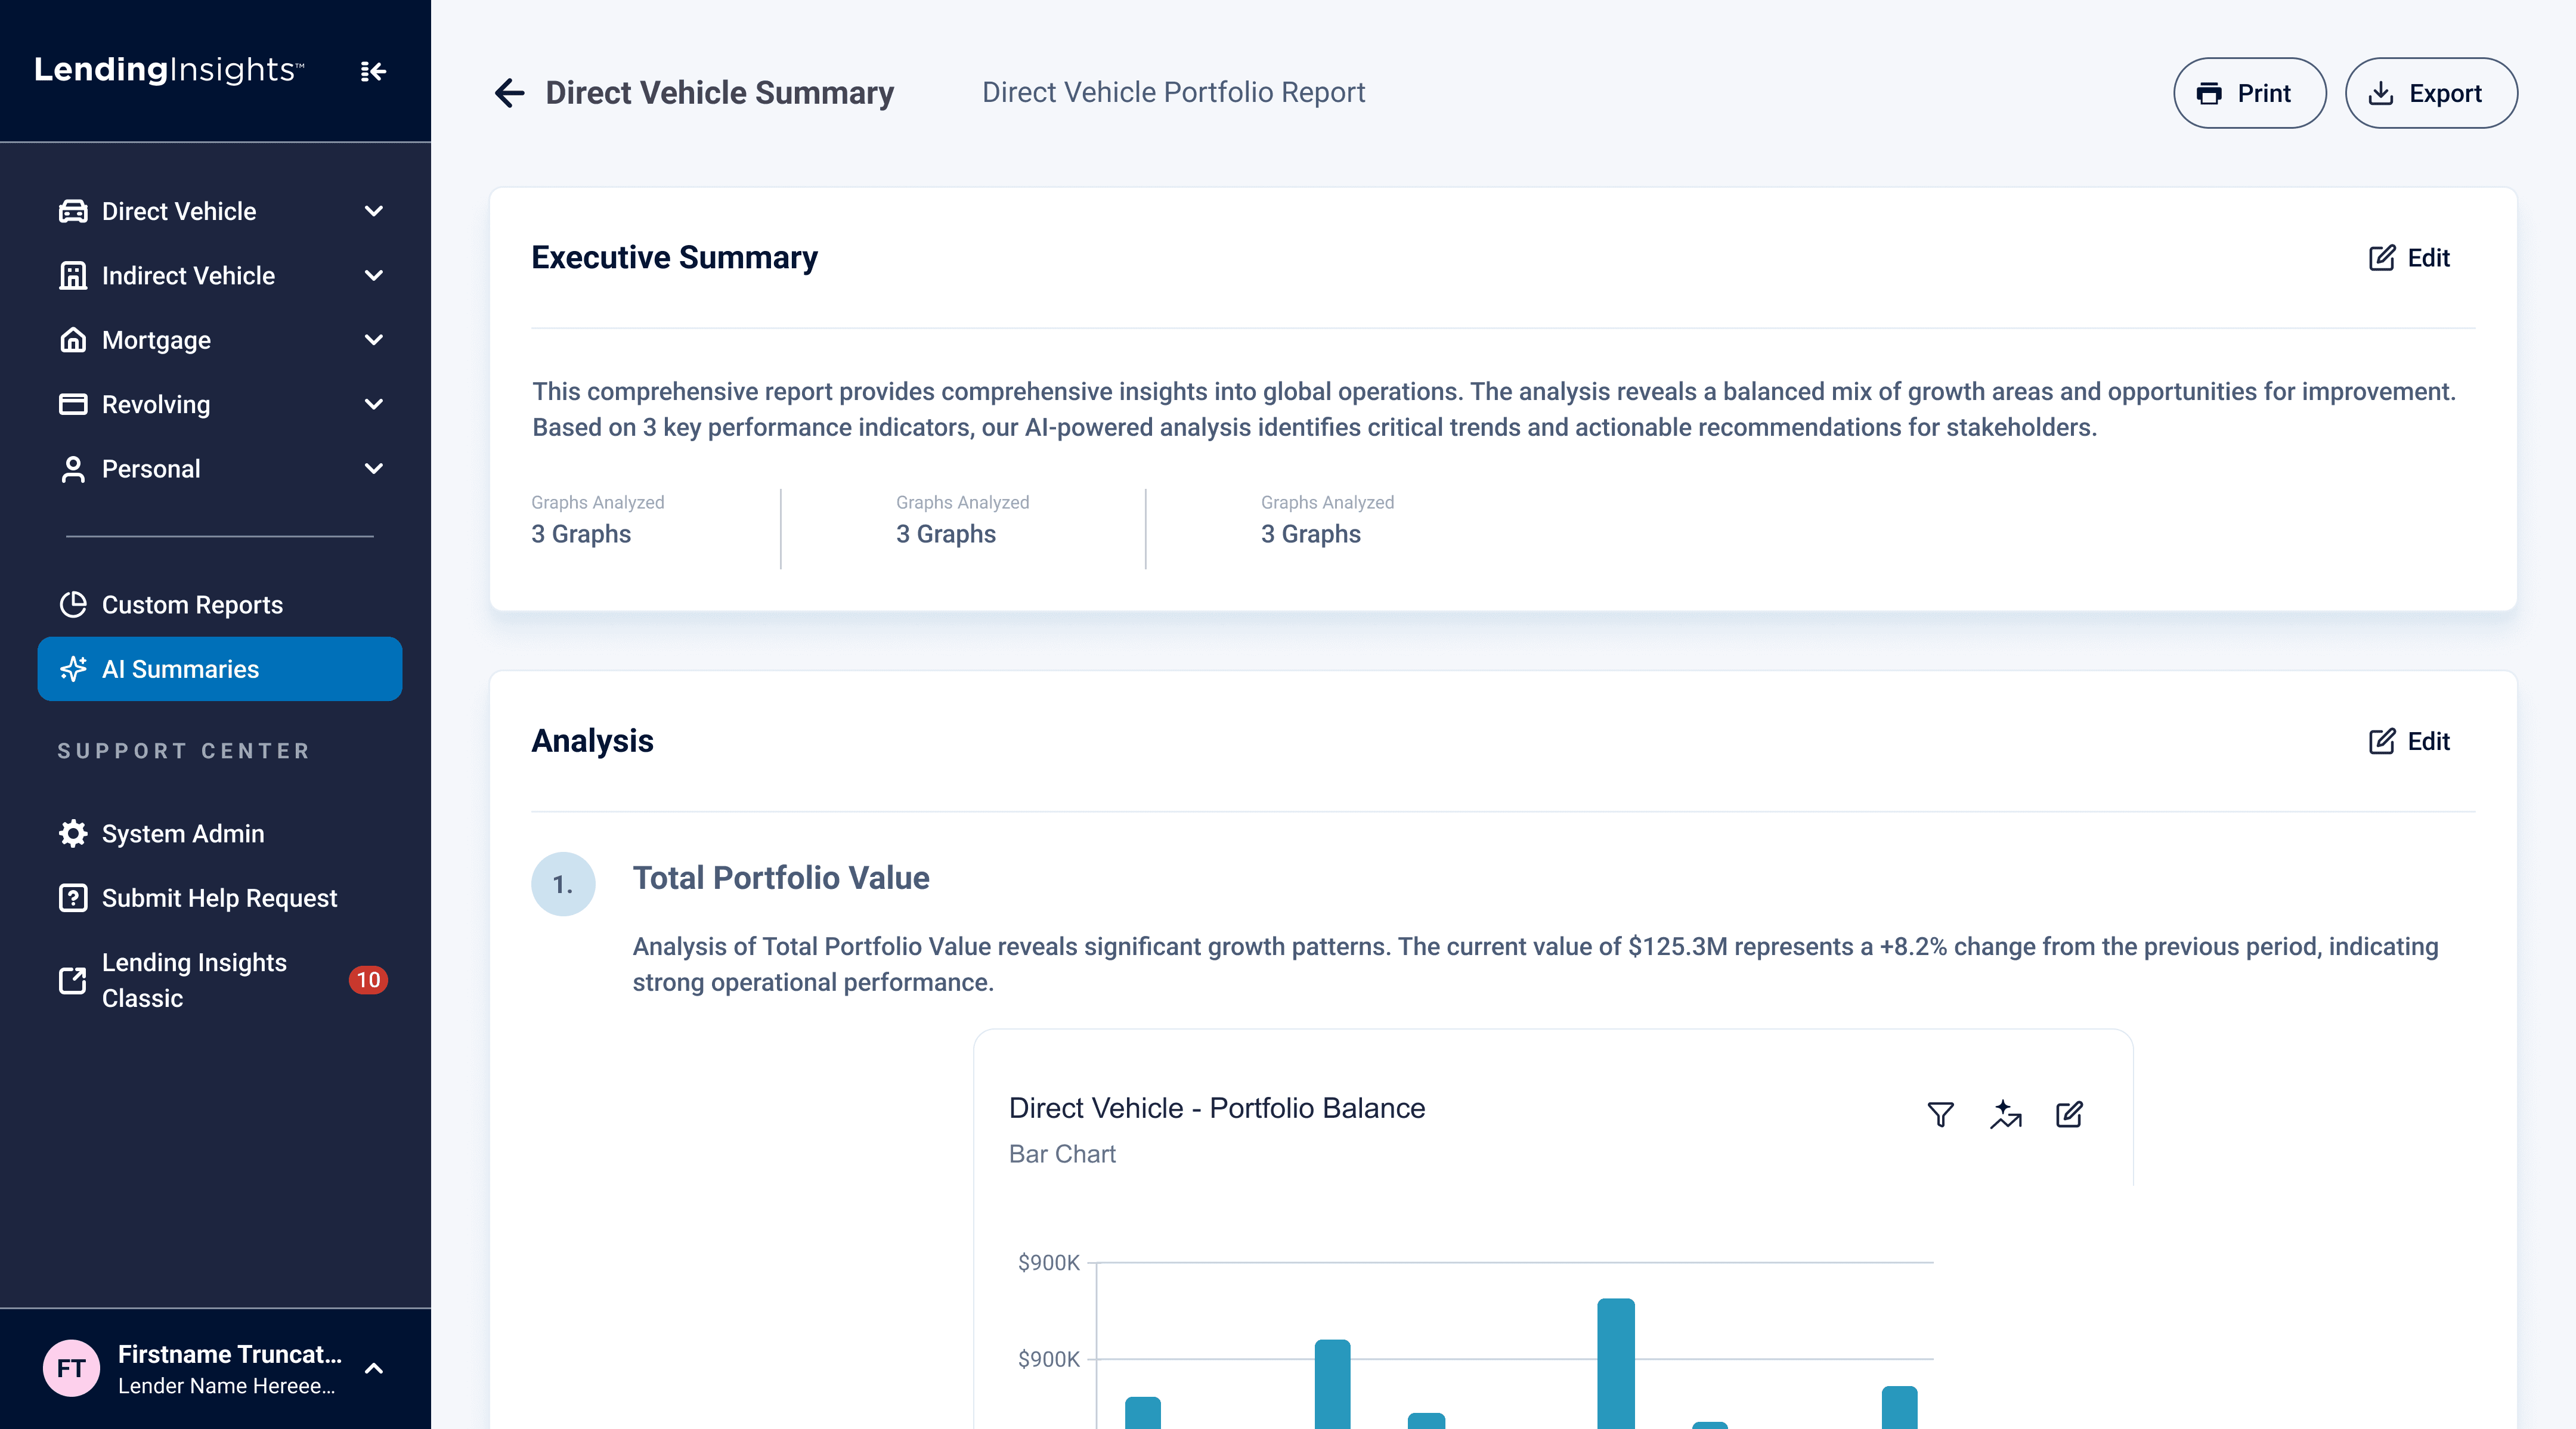
Executive Summary
quick overview of key insights and metrics.
Analysis
detailed insights and suggested next actions based on data selected
Editable
users can edit each section as needed.
Visual Metrics
Visual Metrics
Visual Metrics
%
%
%
Faster task completion
Faster task completion
Faster task completion
Users completed report-building tasks significantly faster after the redesign.
Users completed report-building tasks significantly faster after the redesign.
Users completed report-building tasks significantly faster after the redesign.
%
%
%
Fewer clicks per task
Fewer clicks per task
Fewer clicks per task
Reduced interaction steps made reporting more efficient and less cognitively demanding.
Reduced interaction steps made reporting more efficient and less cognitively demanding.
Reduced interaction steps made reporting more efficient and less cognitively demanding.
↑
↑
Report clarity
Report clarity
Report clarity
Users more easily understood filters, widgets, and data changes in real time.
Users more easily understood filters, widgets, and data changes in real time.
Users more easily understood filters, widgets, and data changes in real time.
What I learned
What I learned
What I learned
End-to-end UI execution
UI execution
UI execution
Translated research into wireframes and high-fidelity UI, strengthening my ability to turn insights into concrete design decisions.
Translated research into wireframes and high-fidelity UI, strengthening my ability to turn insights into concrete design decisions.
Translated research into wireframes and high-fidelity UI, strengthening my ability to turn insights into concrete design decisions.
AI design thinking
AI design thinking
AI design thinking
Used AI to speed up early prototyping and testing, allowing more time for validation and iteration.
Used AI to speed up early prototyping and testing, allowing more time for validation and iteration.
Used AI to speed up early prototyping and testing, allowing more time for validation and iteration.
Team-driven growth
Team-driven growth
Team-driven growth
Learned through team support and feedback, gaining confidence in communicating and refining design choices.
Learned through team support and feedback, gaining confidence in communicating and refining design choices.
Learned through team support and feedback, gaining confidence in communicating and refining design choices.
Aug 2025 - Dec 2025
Aug 2025 - Dec 2025
• Sponsored Project
• Sponsored Project
Overview
Overview
Overview
Brief
Brief
Brief
Transformed legacy enterprise B2B Business platform into modern AI-powered dashboard
Transformed legacy enterprise B2B Business platform into modern AI-powered dashboard
Transformed legacy enterprise B2B Business platform into modern AI-powered dashboard
Role
Role
Role
Product Designer
Product Designer
Product Designer
Timeline
Timeline
Timeline
16 Weeks
16 Weeks
16 Weeks
Team
Team
Team
Jun Hyok Lim
Jun Hyok Lim
Jun Hyok Lim
Ashton Sun
Ashton Sun
Ashton Sun
Vipula Shirse
Vipula Shirse
Vipula Shirse
Brynn Davis
Brynn Davis
Brynn Davis
Ryan Pearson
Ryan Pearson
Ryan Pearson
Anika Gupta
Anika Gupta
Anika Gupta
Amrita Saripalli
Amrita Saripalli
Amrita Saripalli
Background
Background
Background
Project Description
Project Description
Project Description
Lending Insights is Allied Solutions’ BI platform for credit unions. Every month, lending leaders need audit-ready reports and a high-level view of portfolio performance.
However, the legacy custom reporting tool was complex and unintuitive, forcing many users to rely on Allied Support to generate reports, slowing decisions and increasing support load.
102%
User
User
User
Credit Union Lender Team
Credit Union Lender Team
Credit Union Lender Team
They use lending insights to:
They use lending insights to:
They use lending insights to:
Review loan performance
Review loan performance
Review loan performance
Monitor risk
Monitor risk
Monitor risk
Prepare monthly reports
Prepare monthly reports
Prepare monthly reports
Efficiency
Accuracy
Speed
Security
Meaningful Reporting Creation
User Needs
User Needs
User Needs
The Problem to Solve
The Problem to Solve
The Problem to Solve
They need a faster, clearer way to create and customize reports without relying on support, so they can confidently access insights and make timely lending decisions.
They need a faster, clearer way to create and customize reports without relying on support, so they can confidently access insights and make timely lending decisions.
They need a faster, clearer way to create and customize reports without relying on support, so they can confidently access insights and make timely lending decisions.
Current State
Current State
Current State
Pain points
Pain points
Pain points
Confusing reporting setup
Confusing reporting setup
Confusing reporting setup
Ambiguous labels such as “Report Configuration” and “Custom 10”
Ambiguous labels such as “Report Configuration” and “Custom 10”
Ambiguous labels such as “Report Configuration” and “Custom 10”
Unintuitive workflow
Unintuitive workflow
Unintuitive workflow
Multiple complex functions control filters and actions on graphs/tables without feedback
Multiple complex functions control filters and actions on graphs/tables without feedback
Multiple complex functions control filters and actions on graphs/tables without feedback
Missing Core Functionality
Missing Core Functionality
Missing Core Functionality
Users could not filter or search for graphs, nor create multiple graphs of the same measure
Users could not filter or search for graphs, nor create multiple graphs of the same measure
Users could not filter or search for graphs, nor create multiple graphs of the same measure
Goal
Goal
Goal
Guiding question
Guiding question
Guiding question
How might we empower credit union teams to create and manage reports independently, faster and more clearly, with AI guidance?
How might we empower credit union teams to create and manage reports independently, faster and more clearly, with AI guidance?
How might we empower credit union teams to create and manage reports independently, faster and more clearly, with AI guidance?
Make it easier to
Make it easier to
build reports
create custom reports
understand lending performance
apply filters and see changes
customize dashboards
get insights with AI guidance
build reports without support
create custom reports
build reports
create custom reports
understand lending performance
apply filters and see changes
customize dashboards
get insights with AI guidance
build reports without support
create custom reports
Research
Research
Research
Competitive Analysis
Competitive Analysis
Competitive Analysis
To understand how competitors solve common user challenges around navigation, terminology, workflow efficiency, and AI integration within reporting tools, I analyzed different custom reporting platforms and found information from each of the platforms, including Domo, Tabs, Tableau, Sisense, and Fabi AI to identify key custom reporting and AI features.
To understand how competitors solve common user challenges around navigation, terminology, workflow efficiency, and AI integration within reporting tools, I analyzed different custom reporting platforms and found information from each of the platforms, including Domo, Tabs, Tableau, Sisense, and Fabi AI to identify key custom reporting and AI features.
To understand how competitors solve common user challenges around navigation, terminology, workflow efficiency, and AI integration within reporting tools, I analyzed different custom reporting platforms and found information from each of the platforms, including Domo, Tabs, Tableau, Sisense, and Fabi AI to identify key custom reporting and AI features.
Custom Reporting
Custom Reporting
Custom Reporting
Each module has one main dashboard where you can customize widgets, use ready-made reports, and filter information easily.
Each module has one main dashboard where you can customize widgets, use ready-made reports, and filter information easily.
Each module has one main dashboard where you can customize widgets, use ready-made reports, and filter information easily.
Placement & Terminology
Placement & Terminology
Placement & Terminology
The dashboard has simple buttons with icons or clear labels at the top right to add widgets, filter data, and export information.
The dashboard has simple buttons with icons or clear labels at the top right to add widgets, filter data, and export information.
The dashboard has simple buttons with icons or clear labels at the top right to add widgets, filter data, and export information.
AI Opportunities
AI Opportunities
AI Opportunities
The AI feature lets users ask questions, get forecasts, generate reports, see simple summaries, and receive alerts based on their data.
The AI feature lets users ask questions, get forecasts, generate reports, see simple summaries, and receive alerts based on their data.
The AI feature lets users ask questions, get forecasts, generate reports, see simple summaries, and receive alerts based on their data.
Prototype
Prototype
Prototype
AI Prototyping
AI Prototyping
AI Prototyping
I designed two functional prototypes, Version A and Version B, to conduct A/B testing and determine which AI features best support our users' needs. Using Figma Make, our team rapidly developed these contrasting versions to identify the most effective layout and workflow for the final design.
I designed two functional prototypes, Version A and Version B, to conduct A/B testing and determine which AI features best support our users' needs. Using Figma Make, our team rapidly developed these contrasting versions to identify the most effective layout and workflow for the final design.
I designed two functional prototypes, Version A and Version B, to conduct A/B testing and determine which AI features best support our users' needs. Using Figma Make, our team rapidly developed these contrasting versions to identify the most effective layout and workflow for the final design.
*Hover to see touchpoints*
Version A
Version B
Pre-populated Reports
access relevant data through ready-made reports
Ask AI
find specific data by typing questions like "Show car loan risks."
Building report
Configuring widget
Filtering Experience
AI Interaction Points
Saving & Reporting
Version A
Version B
Ask AI
find specific data by typing questions like "Show car loan risks."
Building report
Configuring widget
Filtering Experience
AI Interaction Points
Saving & Reporting
Testing
Testing
Testing
A/B Testing with SMEs
A/B Testing with SMEs
A/B Testing with SMEs
I validated two early design concepts (Version A and Version B) with SMEs, gather actionable feedback, and refine the reporting redesign to better meet user and organizational needs.
I validated two early design concepts (Version A and Version B) with SMEs, gather actionable feedback, and refine the reporting redesign to better meet user and organizational needs.
I validated two early design concepts (Version A and Version B) with SMEs, gather actionable feedback, and refine the reporting redesign to better meet user and organizational needs.
Save
Report Accessibility
Report Accessibility
Report Accessibility
Users prefer having saved reports easily accessible, ideally at the top of the page or within the global navigation, rather than buried inside the custom reporting tool.
Users prefer having saved reports easily accessible, ideally at the top of the page or within the global navigation, rather than buried inside the custom reporting tool.
Users prefer having saved reports easily accessible, ideally at the top of the page or within the global navigation, rather than buried inside the custom reporting tool.
AI Capabilities
AI Capabilities
AI Capabilities
AI forecasting is a desired feature to help users anticipate trends and make data-driven decisions more efficiently.
AI forecasting is a desired feature to help users anticipate trends and make data-driven decisions more efficiently.
AI forecasting is a desired feature to help users anticipate trends and make data-driven decisions more efficiently.
Global Reporting & Flexibility
Global Reporting
Global Reporting
Users want to easily compare and combine data from different widgets in one report, instead of looking at each widget separately.
Users want to easily compare and combine data from different widgets in one report, instead of looking at each widget separately.
Users want to easily compare and combine data from different widgets in one report, instead of looking at each widget separately.
Final Stage
Final Stage
Final Stage
High-Fidelity Design
High-Fidelity Design
High-Fidelity Design
*Hover to see touchpoints*
Custom Reporting Homepage
Custom Reporting Homepage
Custom Reporting Homepage
AI Generator
use AI to generate a report by entering a prompt.
Entry points
prebuilt templates help users to begin without starting from scratch
Recognition
saved reports use previews for quick visual identification
Building Report
Building Report
Building Report
Global Report
apply filter once to update the whole report
Add Widget
Add graphs, KPIs, or tables to display data
Save & Export
save the report and easily preview, download, or share
Add Widget
Add Widget
Add Widget
Customization
set data, chart type, and values for the widget
Live preview
see the widget update instantly as you edit.
Filled Report
Filled Report
Filled Report
AI forecasting
add future projections to a chart by selecting a date range.
AI Summary Prompt
AI Summary Prompt
AI Summary Prompt
AI summary setup
name the summary, choose widgets, and guide AI with optional prompts.
AI Generated Summary
AI Generated Summary
AI Generated Summary
Executive Summary
quick overview of key insights and metrics.
Analysis
detailed insights and suggested next actions based on data selected
Editable
users can edit each section as needed.
Visual Metrics
Visual Metrics
Visual Metrics
%
%
%
Faster task completion
Faster task completion
Faster task completion
Users completed report-building tasks significantly faster after the redesign.
Users completed report-building tasks significantly faster after the redesign.
Users completed report-building tasks significantly faster after the redesign.
%
%
%
Fewer clicks per task
Fewer clicks per task
Fewer clicks per task
Reduced interaction steps made reporting more efficient and less cognitively demanding.
Reduced interaction steps made reporting more efficient and less cognitively demanding.
Reduced interaction steps made reporting more efficient and less cognitively demanding.
↑
↑
Report clarity
Report clarity
Report clarity
Users more easily understood filters, widgets, and data changes in real time.
Users more easily understood filters, widgets, and data changes in real time.
Users more easily understood filters, widgets, and data changes in real time.
What I learned
What I learned
What I learned
End-to-end UI execution
UI execution
UI execution
Translated research into wireframes and high-fidelity UI, strengthening my ability to turn insights into concrete design decisions.
Translated research into wireframes and high-fidelity UI, strengthening my ability to turn insights into concrete design decisions.
Translated research into wireframes and high-fidelity UI, strengthening my ability to turn insights into concrete design decisions.
AI design thinking
AI design thinking
AI design thinking
Used AI to speed up early prototyping and testing, allowing more time for validation and iteration.
Used AI to speed up early prototyping and testing, allowing more time for validation and iteration.
Used AI to speed up early prototyping and testing, allowing more time for validation and iteration.
Team-driven growth
Team-driven growth
Team-driven growth
Learned through team support and feedback, gaining confidence in communicating and refining design choices.
Learned through team support and feedback, gaining confidence in communicating and refining design choices.
Learned through team support and feedback, gaining confidence in communicating and refining design choices.